Trading Strategies Currently on StockSense
SMA Crossover
The SMA crossover strategy is one of the most commonly used technical trading strategies. SMA stands for simple moving average, and is calculated by averaging the closing price of a stock over a period of time. The SMA crossover strategy utilizes two sets of SMAs, one for a shorter period (e.g., 3-day) and one for a longer period (e.g., 15-day). When the shorter period SMA crosses above the longer period SMA, it is considered a bullish price action and a buy signal is generated. Conversely, a sell signal is generated. This strategy can be customized to any timeframe suitable for the trader’s investment horizon. For more information on trading based SMA crossovers, please refer to Resources.
MACD Signal
Moving Average Convergence Divergence (MACD) is another common momentum indicator used by technical traders. The strategy utilizes exponential moving averages (EMA) of historical stock prices. The MACD line is typically calculated by subtracting the 26-day EMA from the 12-day EMA, and an additional signal line is set by calculating the 9-day EMA of the MACD line. A buy (sell) signal is then generated when the MACD line crosses above (below) the signal line. For more information about the MACD signal strategy, please refer to Resources.
Stochastic Oscillator
The stochastic oscillator is a popular momentum indicator used to assess whether a stock has moved into overbought or oversold territories. It is based on the basic premise that if a stock has a rising trend if a stock tends to close near the high end of its trading range during a trading session, and a falling trend if it tends to close near the low end. The oscillating indicator ranges from 0 to 100 and is calculated based on trailing 14-day price actions. Trading strategies derived from this indicator typically have overbought/oversold thresholds set at 80/20. For more information on the stochastic oscillator strategy, please refer to Resources.
Stochastic RSI
Stochastic RSI is another popular momentum indicator used to assess whether a stock is overbought or oversold. It combines the stochastic oscillator with the relative strength index (RSI), which estimates bullish/bearish momentum based on the magnitude of gains and losses sustained in previous trading sessions. Similar to the stochastic oscillator, stochastic RSI is also an oscillating indicator ranging from 0 to 100 and is calculated based on trailing 14-day price actions, with similar common thresholds for overbought/oversold levels set at 80/20. For more information on the stochastic RSI strategy, please refer to Resources.
ARIMA Time Series
ARIMA (Autoregressive Integrated Moving Average) is a statistical analysis model that uses time series data to either better understand the data set or to predict future trends. The ARIMA model can be utilized to devise a trading strategy that can be backtested by the user on StockSense. Processing last 10 years historical stock price data, the best (p, d, q) parameters are selected to predict future price trends. The rolling five-days forward price estimation is then backtesting to assess the performance of the trading strategy. For more information about the ARIMA time series model, please refer to Resources.
Logistic Regression
Logistic regression is a classification model used to describe data and explain the relationship between a dependent binary variable and factors (independent variables) affecting it. In the case of trading based on technical analysis, this involves predicting whether a particular stock would rise or fall based on common trading levels such as moving averages, trading volume, support and resistance levels. StockSense compiles over 40 of such technical factors based on 15 years of historical stock price data and generates a model that can be backtested by the user for each ticker. The strategy is based on binary buy or sell signals generated by the rolling five-day forward prediction from the logistic regression model, with specific return thresholds as parameters. For more information on logistic regression and trading, please refer to Resources.
Backtesting through CPCV for Strategy Selection
As detailed in Advances in Financial Machine Learning chapter 11, the methodology we have implemented here is used for strategy selection, do not use this as a research tool. The goal of backtesting through cross-validation (CV) is not to derive historically accurate performance, but to infer future performance from a number of out-of-sample scenarios. For a high level overview, take a look at our FAQ section.
Combinatorial Purged Cross-Validation
Combinatorial Purged Cross-Validation (CPCV), was introduced to address the issues of backtesting through the walk-forward method, and the usual corss-validation method. The walk-forward method for backtesting has 3 major disadvantages: a single scenario (the historical path of price movement) is tested which causes overfitting, it is not representative of future performance because the result can be biased by a particular sequence of price movement, and finally the decisions defining the strategy are always made on a smaller subset of the historical data that predates the decision. In machine learning, cross-validation is often used to avoid overfitting and hyperparameter tuning, however the same disadvantages still exists for application in backtesting: potential data leakage, single backtest path (although not the historical one), and a lack of historical interpretation.
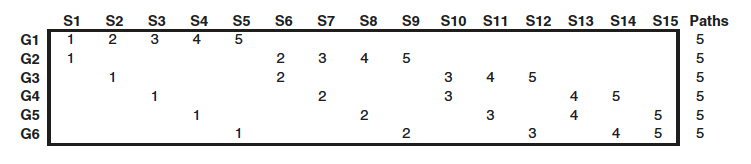
Combinatorial Purged Cross-Validation is a method that allows backtesting on multiple paths. As historical price movement is just the random path that was realized, backtesting on multiple paths means that we are testing our strategy on a wider range of scenarios, not just the anecdotal historical path. In other words, while the random sampling in cross-validation that allows for multiple paths through historical data cannot be implemented for backtesting purposes due to data leakage, CPCV allows us to add this component of multiple paths back into backtesting. For details of how this works please refer to chapter 12 of Advances in Financial Machine Learning. The following figure shows the multiple backtest paths generated when historical data is split into 6 groups, G1-G6, with each split in S1-S15 composed of 2 testing split (numbered groups), and 4 training split (unnumbered groups). For example, path 1 is the result of combining the forecasts from (G1, S1), (G2, S1), (G3, S2), (G4, S3), (G5, S4) and (G6, S5). Observe that each path is a different realization across the train-test splits, and there are no data leakage as G1-G6 are split without shuffling.
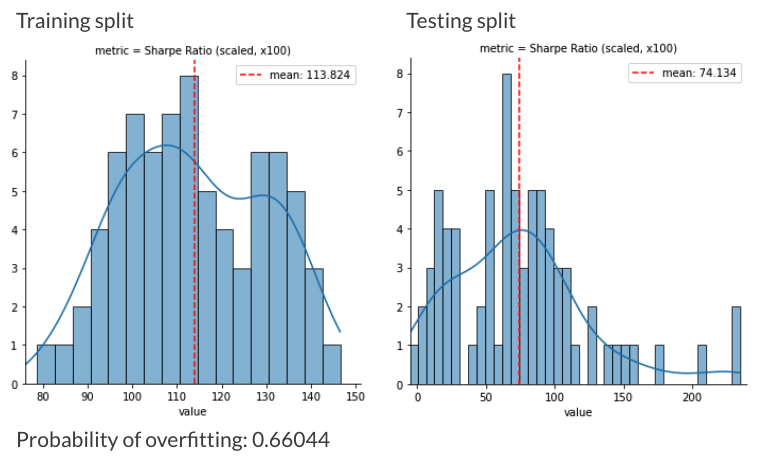
Probability of Backtest Overfitting
PBO is the probability associated with in-sample optimal strategies that underperform out-of-sample. Its calculation is detailed in Chapter 11 of the Advances in Financial Machine Learning, and for the implementation, please refer to Github. Users of StockSense are unlikely to manually fit the indicator based strategies better than StockSense, so the idea for calculating the PBO here is that users should be aware that the more they attempt to optimize their backtest, the more their true Sharpe ratio at trading time will come from the testing split distribution, and the more their strategy will approach the PBO overfitted probability.