StockSense

Trading Signals Reliability Tool for Retail Investors

Hero image
Feature tile icon 02

Transparency

Unlike typical “black-box” solutions for retail traders, StockSense discloses all trading signals and methodologies, along with source code documentation.

Feature tile icon 01

Consistency

Instead of touting the success of certain trading strategies for specific stocks, StockSense utilizes a consistent, simple and accessible user interface, allowing users to customize and evaluate the same trading strategies for multiple tickers and timeframes.

Feature tile icon 03

Data Driven

Avoiding heuristics and subjective pattern-reading from stock charts, reliability metrics on StockSense is based on statistical analysis and rigorous backtesting.

Why StockSense?

StockSense is built in response to the surging popularity of momentum trading among retail investors. Retail investors comprise approximately 20% of the trading volume in the US stock market today[1]. With the rise of commission-free trading platforms, social media and online forums focused on trading, the trading activities of retail investors are becoming an increasingly important driving force behind both stock market returns and volatility, as can be seen from the GameStop trading debacle in early 2021.

Technical analysis is often referenced in media and online trading forums targeted at retail investors as reasons to buy or sell a stock. Frequently, investment recommendations are given through subjective chart-reading without data-driven backup. Retail investors typically do not possess the financial or programming knowledge to properly assess the reliability of these trading strategies on their own, and could be vulnerable to financial losses from following such recommendations.

At StockSense, we believe it is important to educate retail traders on how to evaluate the reliability of technical trading strategies and provide them with the tools to test out strategies themselves. Our mission is to build a user-friendly platform that helps retail traders systematically evaluate trading strategies through backtesting, and statistical analysis, so retail investors could make more informed trading decisions.

How does StockSense work?

StockSense simplifies your due diligence when incorporating technical indicators into your decision making process. Simply input the ticker of your interest into the search bar, and it automatically backtest common technical indicators for your ticker.

Tunable parameters

StockSense allows you to play with different parameters of the indicators. Look at how different parameters affect past performance of these indicators.

Features split image 01

Interactive charting

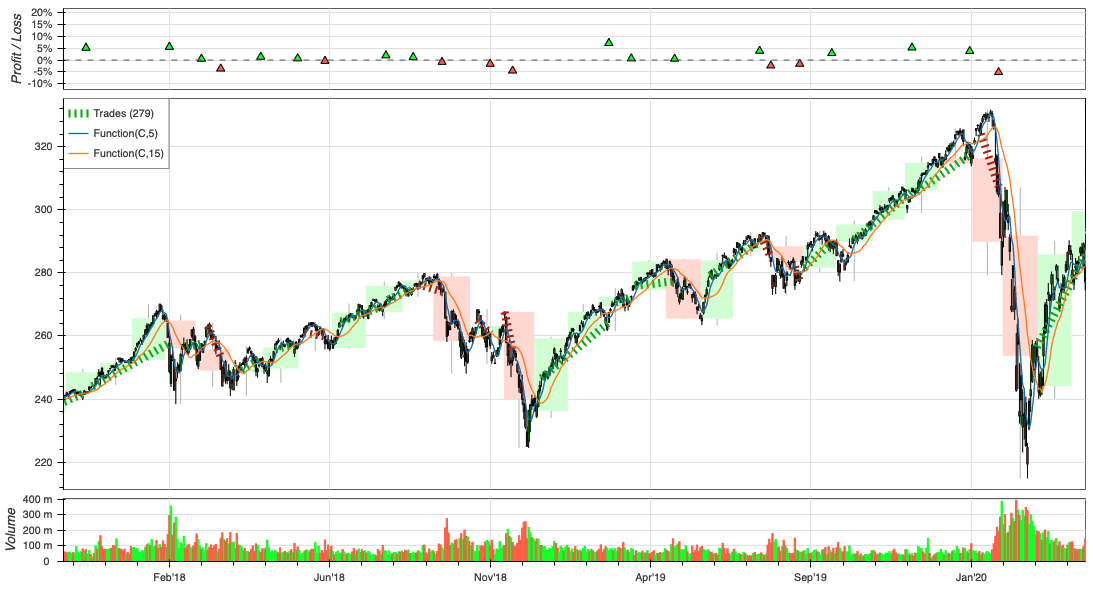
Investigate trends in historical data, and the trades made by the backtests, interactively.

Features split image 02

Robust backtesting

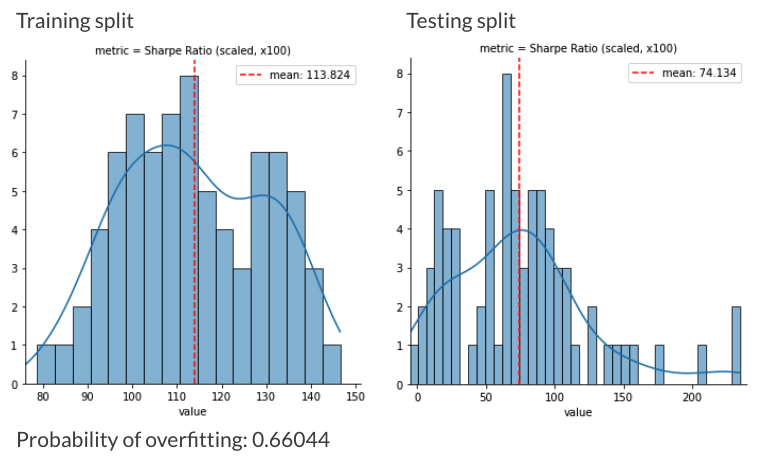
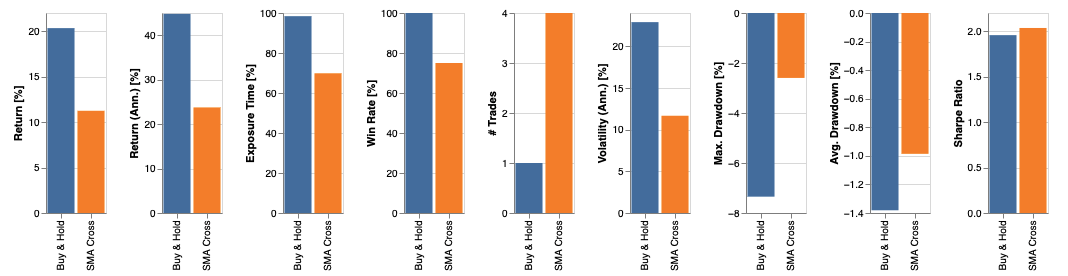
In addition to backtesting over historical data, StockSense validate the reliability of these indicators through quantitative techniques. For more information on how this works, please refer to FAQ and Technical Details.

Features split image 03

FAQ

  • Who is StockSense for?

    StockSense's target users are retail traders, but anyone who wants to question their assumptions of the validity of technical indicators can use the platform.

  • Does StockSense recommend users to trade on technical indicators?

    StockSense does not make any financial recommendations. Traders should not trade stocks based on the indicators that just happen to "worked". This can cause confirmation bias and cause traders to read too much into spurious correlations. We at StockSense believe technical indicators are a single tool in a kit of tools that can be used for defining a trading strategy, traders should not trade purely on technical indicators.

  • What is backtesting?

    Backtesting is a sanity check, an investigation of behavior under a given scenario. It is a historical simulation of how a strategy would have performed should it have been run over a past period of time. It is not an experiment, and does not prove anything. Do not research under the influence of a backtest. Backtesting does not tell us why a strategy has worked, only that it did or did not. The purpose of a backtest is to discard bad models, not to improve them. If the backtest results in risk-return not aligned with your tolerance, you should discard the strategy, not to tune them to fit your tolerance.

  • If backtest cannot help with researching, what does StockSense do?

    StockSense as a platform allows you to sanity check common technical indicators: Has a technical indicator provided well behaved and reliable signal on a specific ticker over the historical timeframe?

  • Why is this important?

    Because technical indicators are touted by a lot of media as some kind of magical tool that always works. If you have been around financial media, you must have heard about support, resistance, and candlestick patterns that foretell a definite market event. Somehow simply by looking at the chart and combining it with some heuristics anyone can start making money fast. StockSense helps you systematically investigate just how "magical" these indicators actually are, for the ticker and timeframe you are interested in. Whether to integrate the results into your decision making should be determined by your personal risk tolerance. More on why we built StockSense and our mission.

  • What does a well behaved signal mean?

    Well behaved for us means that the signal is able to generate consistent return, with low volatility, and high Sharpe ratio. Again, it must be stressed here that this is no guarantee of achieving the same Sharpe ratio if you trade on the same ticker with the same strategy. The past does not repeat itself.

  • What does a reliable signal mean?

    Backtest overfitting is the monetization of random historical patterns when a strategy is developed to perform well on a backtest. Combinatorial Purged Cross Validation addresses this issue of backtest overfitting. A distribution of Sharpe ratios can be generated by testing out an optimized backtest strategy (optimized with in-sample data) on the different testing folds (out-of-sample data). Additionally, cross validation also allows us to generate the probability of backtest overfitting (PBO), which gives us an indication of how likely it is for us to overfit our strategy. What the distribution of the backtest result tells us is then some idea of how well the technical indicator can perform on out-of-sample data. The users should judge on their own whether this distribution of result aligns with their risk tolerance. We recommend you read the book Advances in Financial Machine Learning by Marcos Lopez de Prado if you are interested in these methods. For details and mathematics on this methodology please refer to Chapter 7 and 11 in the book. We have a higher level overview in the Technical Details section.

  • Why does the reliability section not support real-time simulation?

    The current version of reliability testing implementation only demos the functionality. There are several consideration factored into this implementation. As backtesting are simulations, simulating over all the train-test splits for plotting a distribution of statistics takes a long time. The current estimate for running the reliability test for a simple strategy like SMA crossover is roughly 8 minutes, and more complicated strategies can take up to 15 minutes to simulate. To ensure multiple users on our platform do not cause a queue of simulations on our server, we have chosen to run these simulation in advance for a limited number of tickers for the MVP. Future support for real-time simulations are possible with expansion to the infrastructure.

  • What open source packages are StockSense powered by?

    Financial related packages that StockSense use includes backtest.py, yfinance, and ta-lib.